On-chain data shows metrics related to network activity have spiked for Ethereum recently, something that could pave way for a further rally.
Ethereum Transaction Volume & Whale Transfer Count Have Spiked Recently
According to data from the on-chain analytics firm Santiment, Ethereum has seen an uplift in two activity-related metrics. The indicators in question are the Transaction Volume and the Whale Transaction Count.
The first of these, the “Transaction Volume,” keeps track of the total amount of the cryptocurrency (in USD) that users on the ETH network are shifting across the network with their transactions.
Related Reading
When the value of this metric is high, it means the ETH blockchain is processing the transfer of a large number of coins right now. Such a trend suggests the investors actively invest in asset trading.
On the other hand, the low indicator implies the interest in the cryptocurrency may currently be low as the holders are only moving around a low amount of ETH.
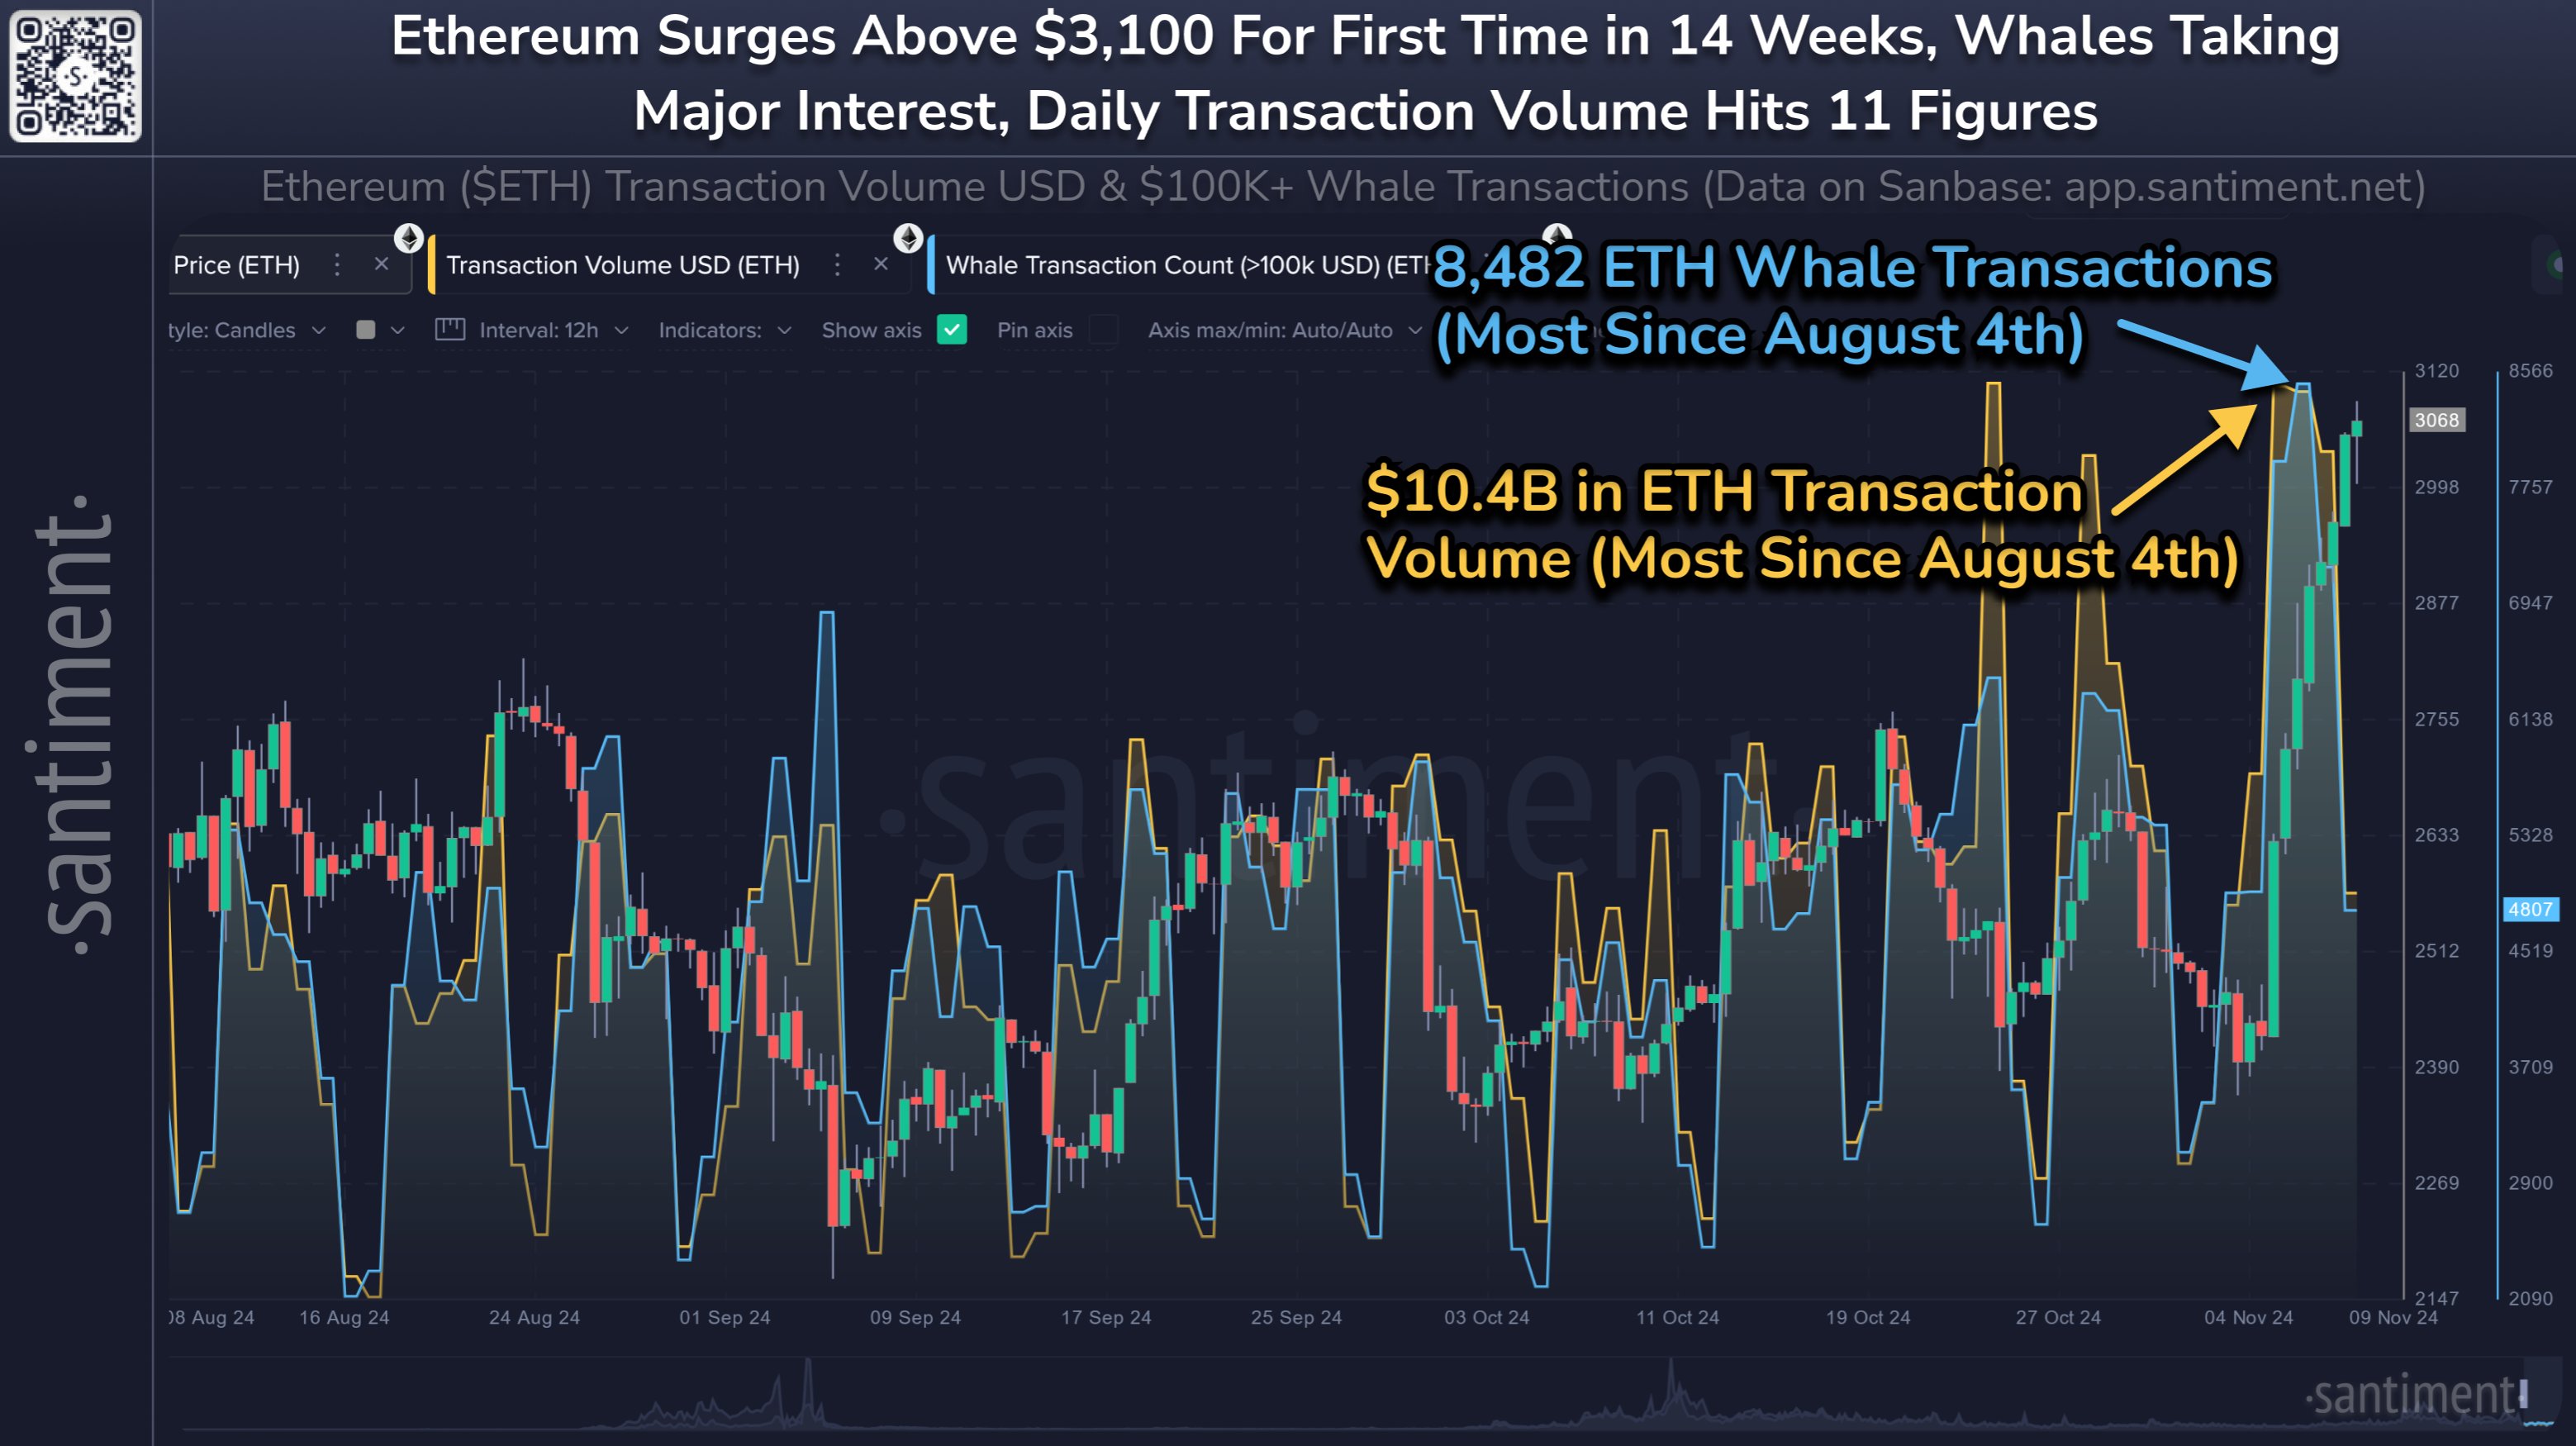
Now, here is a chart that shows the trend in the Transaction Volume for Ethereum over the last few months:
As displayed in the above graph, the Ethereum Transaction Volume has registered a sharp surge recently, implying interest in the asset has increased alongside the price rally.
This could be considered a constructive development for the cryptocurrency, as an increasing network activity is generally required for rallies to be sustainable.
In the past, some price moves have kicked off sharply, but the Transaction Volume didn’t register much of an increase at the same time. Such moves generally died out before long.
The chart also contains the data for the other metric of relevance here, the “Whale Transaction Count.” This indicator measures the total amount of ETH transfers valued at more than $100,000.
Transactions of this scale are assumed to be coming from the whale entities, so the Whale Transaction Count reflects the activity level of the big-money investors.
From the graph, it’s apparent that this indicator has also spiked for Ethereum recently, which implies that the recent increase in the volume isn’t just a sign of interest from the smaller investors but also the humongous hands.
Naturally, it’s impossible to say based off these indicators alone, whether the investors are buying or selling, as all types of transactions look the same from their view. Because ETH has seen a sharp rally recently, this activity has probably been for accumulation so far.
Related Reading
The analytics firm explains,
Expect any growth from Bitcoin, during this bull run, to see profits redistribute into Ethereum and potentially push it toward its own all-time high while its network activity looks very healthy.
ETH Price
After observing a surge of more than 27% over the last seven days, Ethereum has broken beyond the $3,150 level.
Featured image from Dall-E, Santiment.net, chart from TradingView.com
