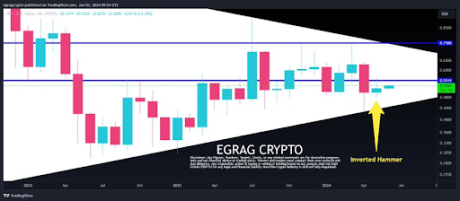
Crypto analyst Egrag Crypto has revealed a bullish pattern that recently formed on the XRP price chart. The analyst also revealed how high the crypto token could rise once it makes this move to the upside.
Inverted Hammer Forms On The Chart
Egrag highlighted an Inverted hammer that had formed on XRP’s chart while noting how bullish this was for the crypto token. He claimed that last month’s candle formation showed a 75% Inverted Hammer at the bottom, which is “super bullish” for XRP. Egrag believes this is an “amazing sign” that the altcoin could rise to $0.75 soon enough. He added that July will be a “month of fireworks” for XRP.
Related Reading

XRP’s possible rise to $0.75 is significant, as Egrag had previously highlighted that price level as a “critical breakout point” for XRP. Back then, he mentioned that XRP was “poised” to achieve this breakout in the coming weeks. He suggested an XRP breakout above that price level would send it to $1.5, and the crypto token could enjoy a further upward trend to $7.5.
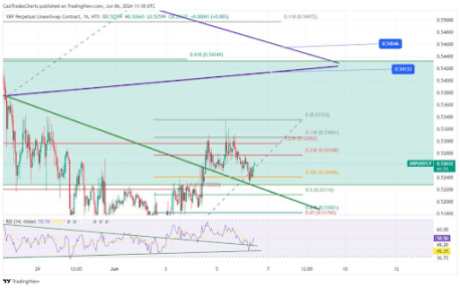
Crypto analyst CasiTrades also recently provided a bullish narrative for the altcoin. She stated that the crypto token is maintaining its bullish momentum and bouncing off the 0.382 retracement level. The analyst added that XRP has finally flipped a trendline that had acted as resistance for months to support.

Meanwhile, CasiTrades highlighted $0.54 as a price level to keep an eye on, stating that XRP could encounter resistance at that level. She suggested that the coin could enjoy a parabolic move if it breaks out above that price level, remarking that it is a “crucial level to watch for a potential breakthrough.”CasiTrades previously raised the possibility of the altcoin rising to as high as $80 when it breaks out from a consolidation triangle.
XRP Is On The Brink Of A Parabolic Rally
Crypto analyst Mikybull Crypto recently suggested that XRP was on the brink of a parabolic rally. He stated in an X post that the token is currently at the level it was in 2017 and 2020, which triggered a “massive rally” for the crypto token on both occasions. In 2017, the altcoin enjoyed a price gain of 61,000% in 280 days.
Related Reading
The chart that Mikybull Crypto shared showed that the altcoin could rise to as high as $5. Meanwhile, crypto analyst XRP Captain claimed that the altcoin was ready for the “massive breakout.” He claimed that XRP is in the “middle of apex. ” Crypto analyst Jaydee also agreed with XRP Captain that a breakout is imminent, stating that “it’s coming,” although he claimed that “beginners” will miss out on the run.
At the time of writing, XRP is trading at around $0.52, up in the last 24 hours, according to data from CoinMarketCap.
Featured image created with Dall.E, chart from Tradingview.com
